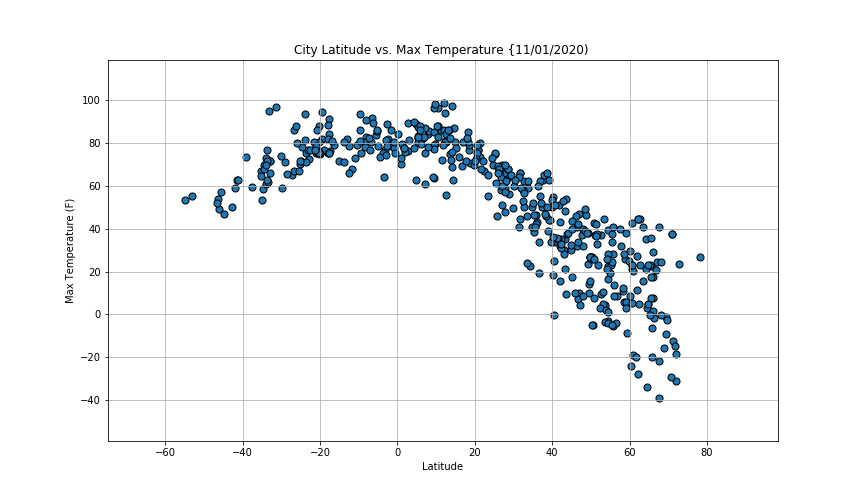
City Lattitude vs. Max Temperature
The purpose of this project is to visualize the weather of 500+ cities across the world of varying distance from the equator.
After assembling the dataset, we used Mathplotlin to plot various aspects of the weather vs. latitude. Factors we looked at included: temperature, cloudiness, windspeed, and humidity. This site provides the source data and visualizations created as part of the analysis, as well as explainations and descriptions of any trends and correlations witnessed.
City Lattitude vs. Max Temperature
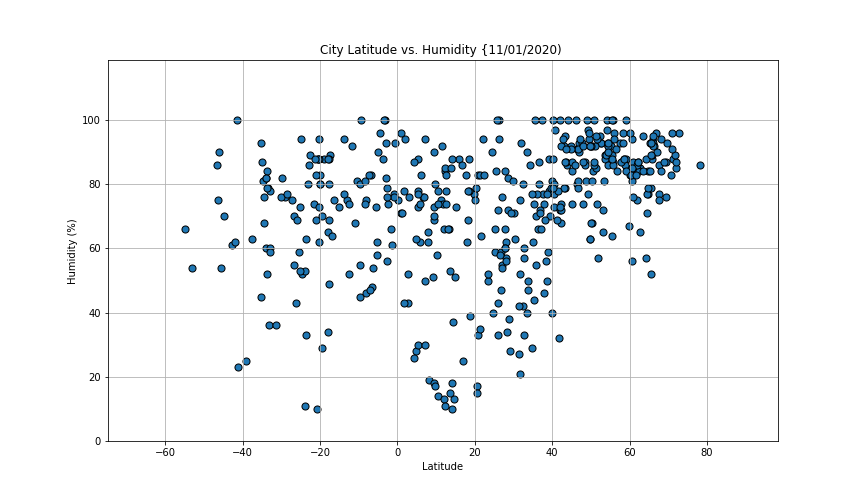
City Lattitude vs. Humidity
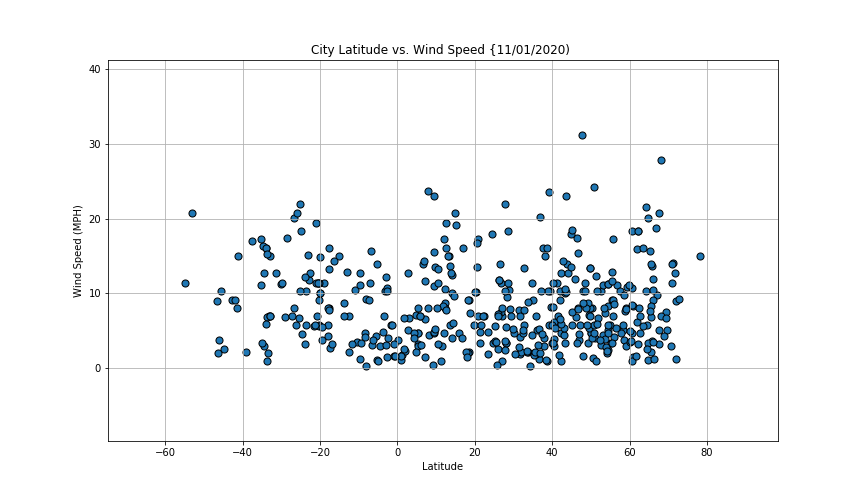
City Lattitude vs. Wind Speed
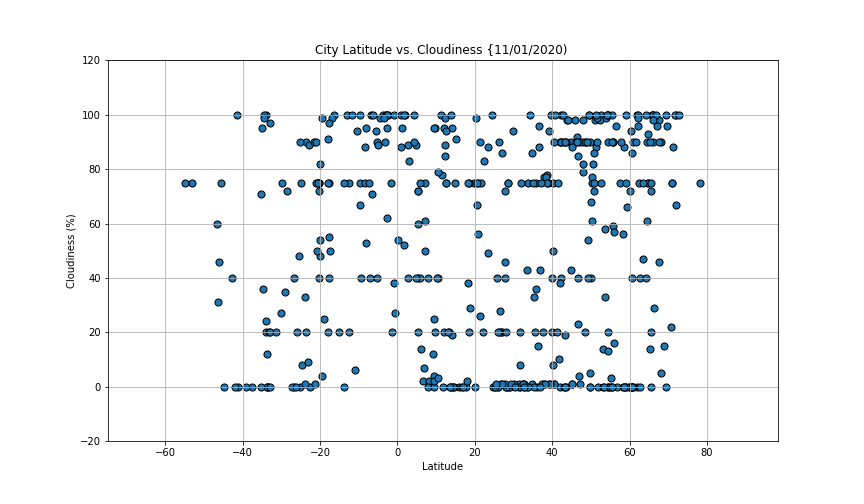
City Lattitude vs. Cloudiness